Author: Tarryn-Leigh Frans
Tarryn-Leigh is the Marketing Manager at PPO. She is enthusiastic about business improvement and is keen to share information and influence change. In her free time, she loves traveling, reading, and spending time with her husband and dogs.
So far, we’ve brought you the Chart Widget (Donuts & Tree maps) and visualising and interacting your lists has never been easier. But it hasn’t stopped there. Our new Key Metric Widget is the latest widget and it’s inching us closer to a configurable home page.
Since launching Conversations in 2022, it’s become a popular collaboration feature among project teams. So, we’ve added an improvement that will make your day-to-day life easier, specifically for capturing Time Entries. You’ll notice that when the “Items I updated this week” filter under Options is applied on the Time Entries page, your time sheet is pre-populated with items where you’ve started or replied to a Conversation, in addition to the entity updates.

We spent most of 2022 encouraging our users to log new product ideas and accelerating the development of new features. This allowed us to fine tune existing functionality and introduce new features – all based on valuable user feedback. From List Widget, Chart Widget, Conversations & Feed Widget, Business Intelligence (BI) API and Exporting your PPO lists in one click, we hope that you’re finding value in these awesome enhancements.

At the start of the year, we made a commitment to accelerate the development of new features and enhancements to ensure that the product keeps moving forward. Our DevOps team has been working tirelessly to bring new features, some small but all mighty in improving your user experience. The journey started with the introduction of our first widget which brought you interactive Gantt views, improved filter controls, improved formatting and general usability improvements. There’s no question that 2022 was a year of awesome new features but let’s recap some of our more recent enhancements.

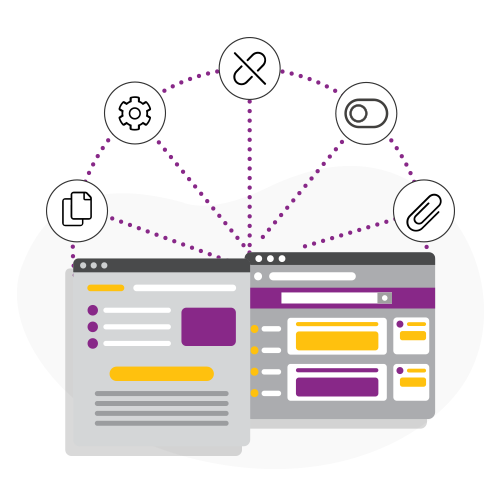
Today marks the launch of Conversations in PPO – a new collaboration feature designed to keep project communications and collaboration flowing. This feature provides the ability to have informal chats, add images and documents, reply using familiar reactions, tag in teammates and interested parties and share knowledge and content on any entity (risks, issues, projects, documents and even approvals), you choose.

Good news! PPO Admins with the help of our new drag and drop capability can now finally adjust the sort order of entities for all users on the Home and Project View pages. You will need access to the System Configuration settings under the Administration menu. Did we mention that’s super easy to update? In less than 5-min, we’ll show you this small but mighty feature in action.
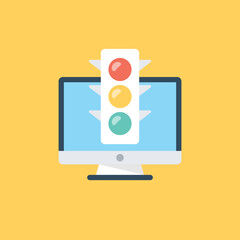
The RAG acronym stands for RED, AMBER, GREEN. These colours make up the traffic light colours used by most project managers to convey their subjective view of a project’s status. A RED traffic light normally indicates there are problems on the project (or an aspect of it); AMBER indicates there are issues that are being dealt with by the team but acts as a warning, and GREEN generally indicates that everything is okay.
Scheduling report mailers is a feature that has been around for a couple of years now. I’ll assume for just a minute that not everyone is aware of this time-saving feature. This feature automates the scheduling of existing PPO reports or dashboards to a specified list of users at a defined frequency (daily, weekly, monthly, etc.).
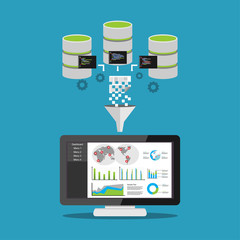
Today, we take a giant leap forward with the introduction of this highly anticipated feature. We’re launching the PPO Business Intelligence (BI) API, making it possible for you to build your own reports and dashboards by easily connecting your PPO data to your BI reporting tool of choice.