PPO delivers functionality for every aspect of project portfolio management

Streamline your projects with PPO’s powerful features

A shopping cart filled with documents, a tablet, and a smartphone. Next to the cart, handwritten text reads packed with features with an arrow pointing to the cart.
Illustration of a smiling woman with brown hair, wearing a yellow top and gray skirt, surrounded by floating charts, graphs, and a check mark, representing data analysis or business success.

Single Source of Data

Greater visibility with consolidated project, programme & portfolio data

A cartoon businessman in a suit holds a large glowing light bulb, standing next to a signpost with multiple purple directional arrows pointing in different directions.

Make Smarter Decisions

Professional reporting across portfolios, programmes and projects.

Illustration of a purple circular arrow with gears inside, a clock, lightbulb, pie chart, a smiling woman, and a man in a hard hat, representing workflow or project management concepts.

Support Multiple Methodologies

Automated project governance alignment & reporting

Illustration of a smiling person in glasses and a tie on a computer screen, surrounded by data charts, a warning icon, a traffic light indicator, and a magnifying glass.

Full Visibility & early warnings

Real-time tracking of progress, cost & resource performance
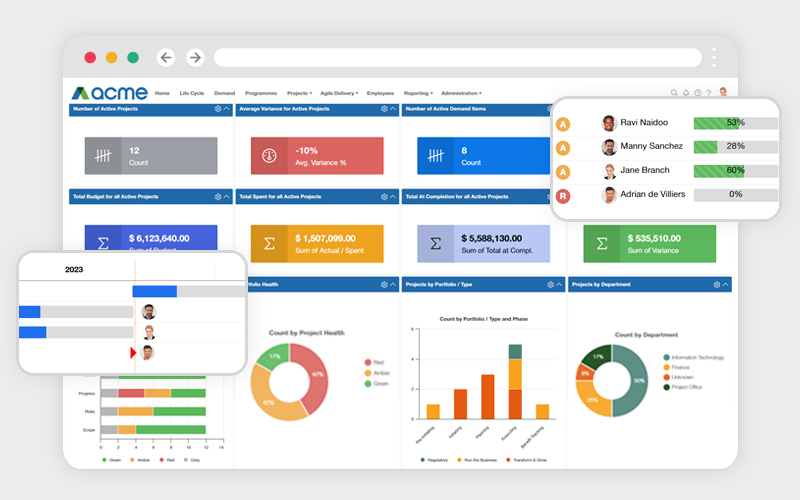
A project management dashboard displays charts, graphs, and performance metrics. Pop-up panels show team members names, progress percentages, and avatars, along with various data visualizations and summary tiles.

Portfolio Management

Align projects and programmes to strategic themes and centralise visibility into the performance of projects and portfolios.

LEARN MORE

Illustration of a glowing yellow lightbulb with a purple checkmark in the center, symbolizing a bright idea or successful solution.

Demand Management

Collect and evaluate all work requests across the organisation through a standard centralised process.

LEARN MORE

A clipboard with a checklist of three purple check marks and a large yellow warning circle with an exclamation mark overlaps the bottom right corner.

Project Management

Empower project teams to plan, track and proactively manage all related work in one place.

LEARN MORE

A clock with black hands is overlaid by a yellow and a purple curved arrow forming a circular loop, suggesting a continuous process or cycle. A thick gray arrow runs horizontally beneath the clock.

Agile & Hybrid Delivery

Support teams and how they want to work, whether that’s via a waterfall approach, an agile framework or somewhere in between.

LEARN MORE

Illustration of a stopwatch with a yellow border, purple buttons, and a single purple hand pointing upward, indicating the 12 oclock position.

Time Tracking

Automate and simplify the process of recording time spent on project & non-project work.

LEARN MORE

Three overlapping speech bubbles: one gray, one yellow, and one purple, each with three dots inside, symbolizing conversation or communication. The background is light gray.

Collaboration & Communication

Centralise project communications with a personalised feed that keeps project teams informed.
LEARN MORE

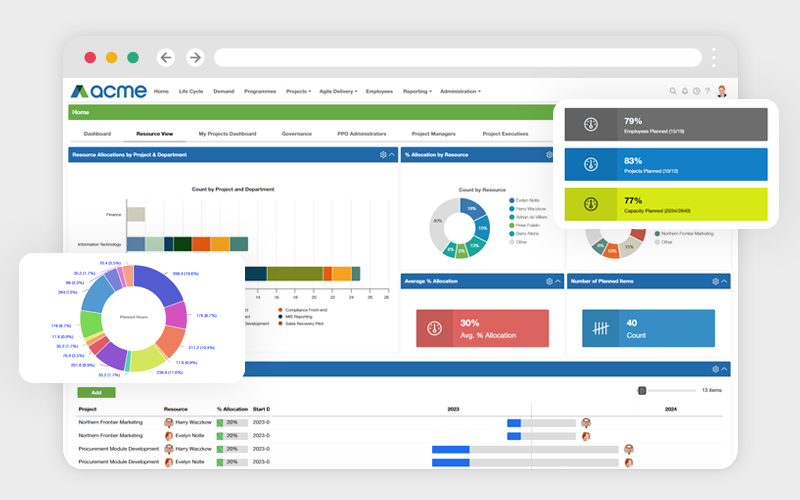
A dashboard displays resource allocation charts, pie graphs, progress bars, and project timelines. Pop-up windows show percentage statistics and a colorful donut chart. The interface is from a management software called acme.

Resource Management

Anticipate demand, optimise work load and gain insights into resource capacity and availability.

LEARN MORE

A gray calculator with a purple display and buttons is shown next to a stack of gold coins with dollar signs.

Cost & Budget Management

Control your portfolio and project finances by recording and tracking budgets, actuals, commitments and forecasts.

LEARN MORE

A gauge with a purple and dark purple dial, a grey needle pointing to the upper right segment, and the yellow letters KPI in the center, indicating key performance indicator measurement.

KPI & Goal Tracking

Analyse strategy performance with key performance indicators (KPI) and benefit tracking.

LEARN MORE

Illustration of three stacked documents: the top page is white with purple lines and a folded corner, beneath it is a yellow page, and at the bottom is a purple page.

Document & Knowledge Management

Centrally store, categorise and manage unlimited project documents of any type accessible from anywhere.

LEARN MORE

Illustration of a web browser window with the text API and a large gray gear symbol in front, representing API settings or configuration.

APIs & Integrations

Connect PPO with any existing API supported business tools and bring all project related data together in one place.

LEARN MORE

An illustration of a computer monitor displaying a simple flowchart with colored shapes connected by lines, representing a process or diagram.

Automations & Workflow

Simplify workflows and automate manual processes, gates and document approvals or routine project activities.

LEARN MORE

Illustration of three vertical bar graphs in yellow, purple, and lavender, a yellow and purple pie chart, and a gray upward arrow, representing data analysis or business growth.

Analytics & Insights

Improve decision making and leverage out-of-the box reports and dashboards for a consolidated or single focus.

LEARN MORE

There’s much more.
Questions? Chat to us.