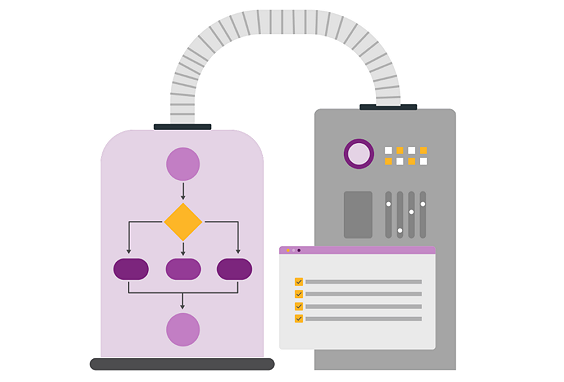
Your Data, Our Priority: How We Keep It Safe
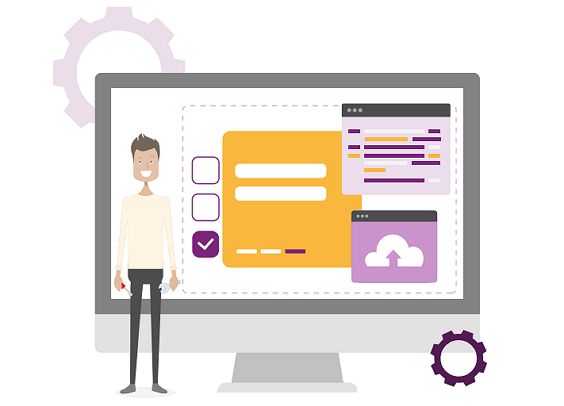

At PPO, protecting your data is at the heart of everything we do. From encryption and secure access to 24/7 monitoring, we’ve built a strong foundation of trust and transparency. With 100% uptime and zero breaches over the past 8 years, your data is in safe hands. Learn how we keep it secure — and how you can too.