Analytics & Insights
Leverage out-of-the-box reports and dashboards for a consolidated or single focus and make better decisions with real-time visibility of project, programme and portfolio performance.

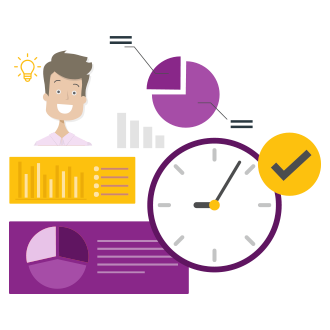
Smarter decision making with real-time insights
Analyse projects and programmes to quickly spot trends and emerging issues.
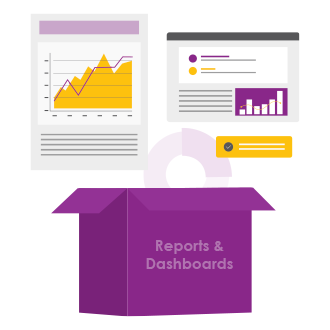
Generate out-of-the-box reports & dashboards
Share and send reports to keep stakeholders in the loop.
Build your own Reports & Dashboards with our BI API
Increased flexibility to manage changing stakeholder information needs.
Smarter Decision Making with Real-Time Insights
Consolidate key information with single-focus reports or summarised graphical dashboards.
Generate out-of-the-box reports & dashboards
Track portfolio health, and monitor project performance and other KPIs with detailed history & trend reporting. Export reports and dashboards to PDF or Excel
Configurable Home Page Views
Visualise and customise your home page views based on your data needs.

