Author: Tarryn-Leigh Frans
Tarryn-Leigh is the Marketing Manager at PPO. She is enthusiastic about business improvement and is keen to share information and influence change. In her free time, she loves traveling, reading, and spending time with her husband and dogs.

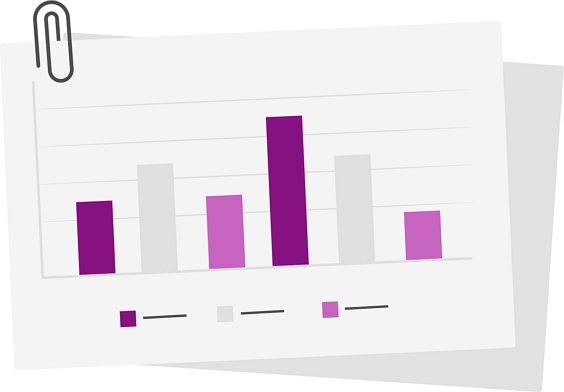
Implementing PPO for portfolio reporting is easy, you don’t need high maturity or detailed end to end portfolio management processes. If your PMO is still relying on static snapshots without the ability to compare performance, discover how your PMO can ditch the paper and automate your portfolio status reports in PPO!
In this PPO Tip, one of our developers shows how the DevOps team uses work item conversations to collaborate, share updates, and keep everything aligned within their Agile way of work. It’s a simple yet powerful way to stay connected and keep work moving!

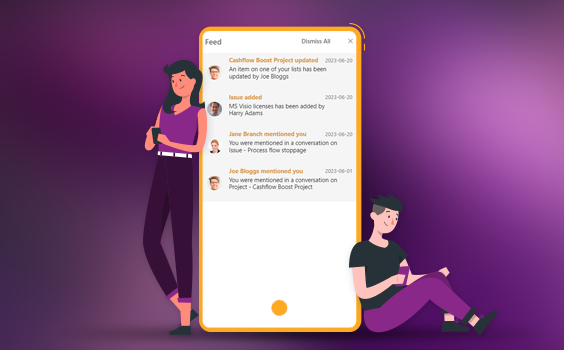
We’ve taken the first step in modernising the PPO experience with a sleek side panel that lets you view, add, or edit items in a single click – no new tabs, no extra steps. This is part of a broader rollout to make PPO quicker and easier to use.
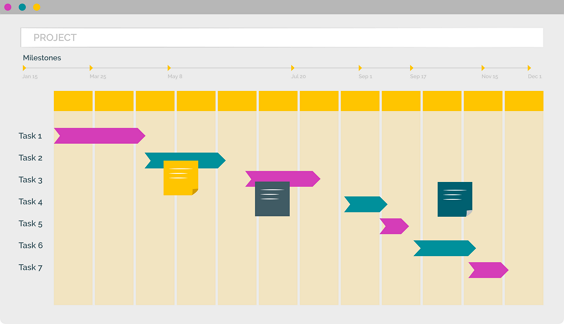
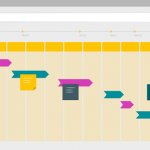
We’ve rolled out a series of powerful enhancements to PPO’s Scheduler, including visual dependency arrows, colour-coded bars and milestones, support for lead and lag, column header wrapping, inclusive end dates for milestones, and more. These updates bring greater consistency across task pages and improved usability for project teams.
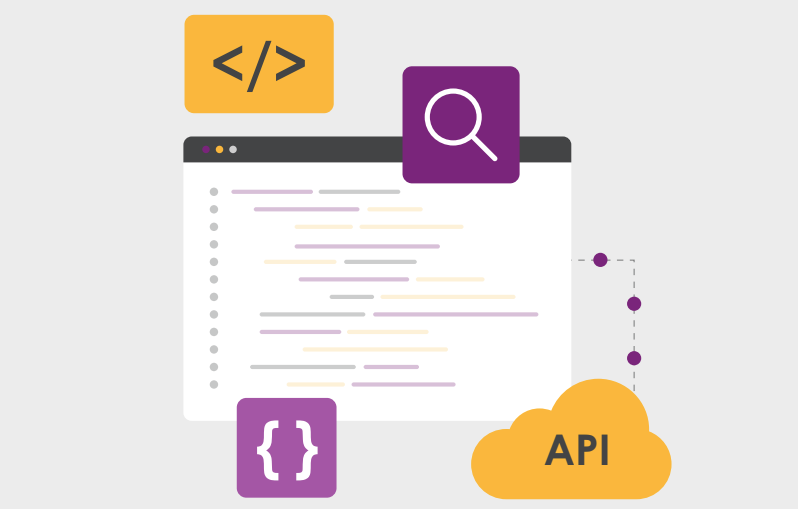
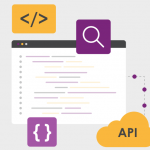
PPO’s API has been enhanced to support the update of custom list items via a new web method. This addition complements existing retrieval methods and enables seamless, automated list management for more efficient system integration.
In our latest product webinar, we introduced PPO’s new multiple resource assignment feature — a game-changer for task management and scheduling. We also shared the latest Scheduler enhancements that make planning even more intuitive. Plus, in our client spotlight, Certa Ireland showcased how automating document approvals with PPO has improved efficiency, reduced risk, and strengthened governance.

The University of Johannesburg (UJ), supported by Project Portfolio Office (PPO), has been awarded Intelligent Education Implementation of the Year at the Intelligent ICT Awards Africa 2025. The award recognises the success of UJ’s OnePMO initiative, powered by PPO’s project portfolio management software, in driving digital transformation, improving governance, and aligning project delivery with institutional strategy.
We’ve rolled out three impactful updates to the grid widget — all inspired by real user feedback. You can now copy rows with a click, control how interval dates are calculated, and enjoy a more intuitive Edit in Grid experience. Whether you’re planning, editing, or duplicating data, the grid is now faster, clearer, and easier to use than ever.
We’ve just added a handy enhancement to PPO’s standard usage report — you can now group by User Group! Until now, you could group usage by various resource fields (like department or job title), but not by the actual user groups set up in PPO. That’s changed.
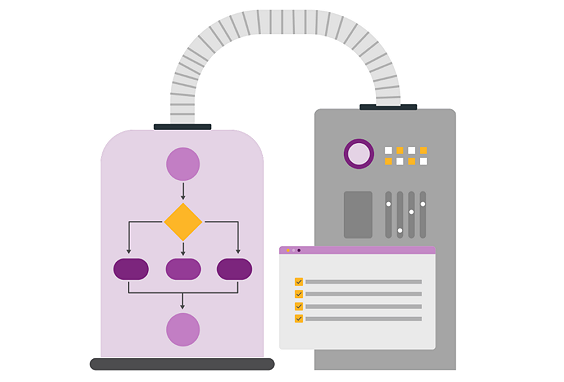
PPO introduces Planned Progress Calculation at the Task Level, eliminating the need for MSP imports and making project tracking more seamless than ever. With this enhancement, task-level progress updates in real time, rolling up to summary tasks and the overall project for greater accuracy and transparency.