Skip to content
Menu
Product
Features
Solutions
Pricing
Webinars
Services
Support
Support Portal
Training
Company
About Us
Events
Blog
Our Clients
Our Partners
Our Community
We’re Hiring
Sign Up
Free Trial
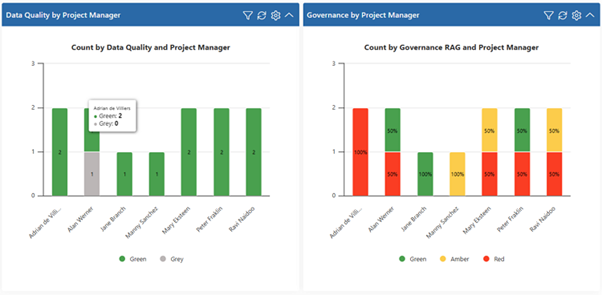
bar-chart-labels
Post navigation
Published in
Bar Chart Labels Now Available in PPO