Skip to content
logo
  • Product
    • Features
    • Solutions
    • Pricing
    • Webinars
  • Services
  • Support
    • Support Portal
    • Training
  • Company
    • About Us
    • Events
    • Blog
    • Our Clients
    • Our Partners
    • Our Community
    • We’re Hiring
  • Sign Up
  • Free Trial
Previous image
Next image

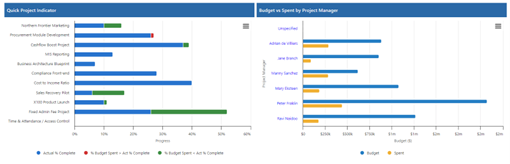
portfolio-schedule-performance

Two bar charts: the left chart shows project progress for various tasks, using red, blue, and green bars; the right chart displays budget vs. spent by project manager, with blue and yellow bars for each name.
Posted on Tuesday, 10 September 2024 Full size 510 × 164

Post navigation

Published inMastering Portfolio Status Reporting – Key Elements for an Effective Portfolio Report

Our Product

Tour Features Solutions Pricing Training Webinars Fact Sheets Support

Our Services

Maturity Assessment

Our Community

PMO Forum PMO Awards
  •  LinkedIn
  •  Twitter
  •  Facebook
  •  Youtube

Our Company

About Us Events Blog Our Clients Partners Our Community We're Hiring
  • Privacy Notice
  • Terms & Conditions
  • Accessibility Statement
  • Security
  • © Project Portfolio Office 2025