Skip to content
logo
  • Product
    • Features
    • Solutions
    • Pricing
    • Webinars
  • Services
  • Support
    • Support Portal
    • Training
  • Company
    • About Us
    • Events
    • Blog
    • Our Clients
    • Our Partners
    • Our Community
    • We’re Hiring
  • Sign Up
  • Free Trial
Previous image
Next image

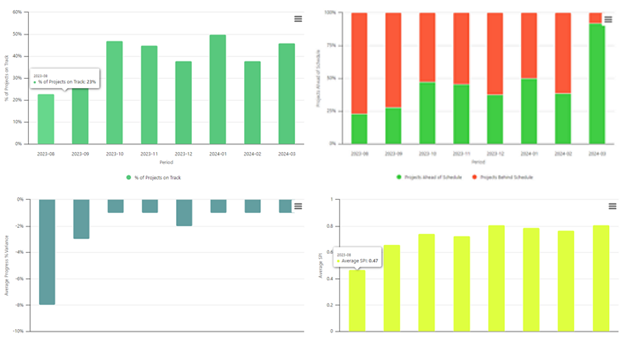
business enablement monthly snapshot

A dashboard with four bar charts showing project performance metrics: % of projects on track over time, project schedule status, average task variance, and average SPI (Schedule Performance Index) for various periods.
Posted on Tuesday, 19 March 2024 Full size 624 × 337

Post navigation

Published inHarmony PMO automates Project Manager Scorecards with PPO

Our Product

Tour Features Solutions Pricing Training Webinars Fact Sheets Support

Our Services

Maturity Assessment

Our Community

PMO Forum PMO Awards
  •  LinkedIn
  •  Twitter
  •  Facebook
  •  Youtube

Our Company

About Us Events Blog Our Clients Partners Our Community We're Hiring
  • Privacy Notice
  • Terms & Conditions
  • Accessibility Statement
  • Security
  • © Project Portfolio Office 2025