Skip to content
Menu
Product
Features
Solutions
Pricing
Webinars
Services
Support
Support Portal
Training
Company
About Us
Events
Blog
Our Clients
Our Partners
Our Community
We’re Hiring
Sign Up
Free Trial
Previous image
Next image
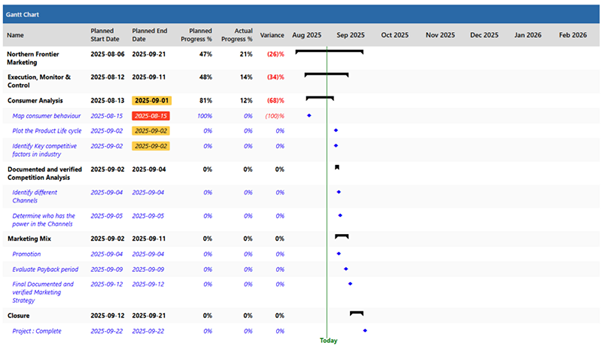
old-gantt
Post navigation
Published in
Scheduler – Gantt & PDF Improvements in PPO